
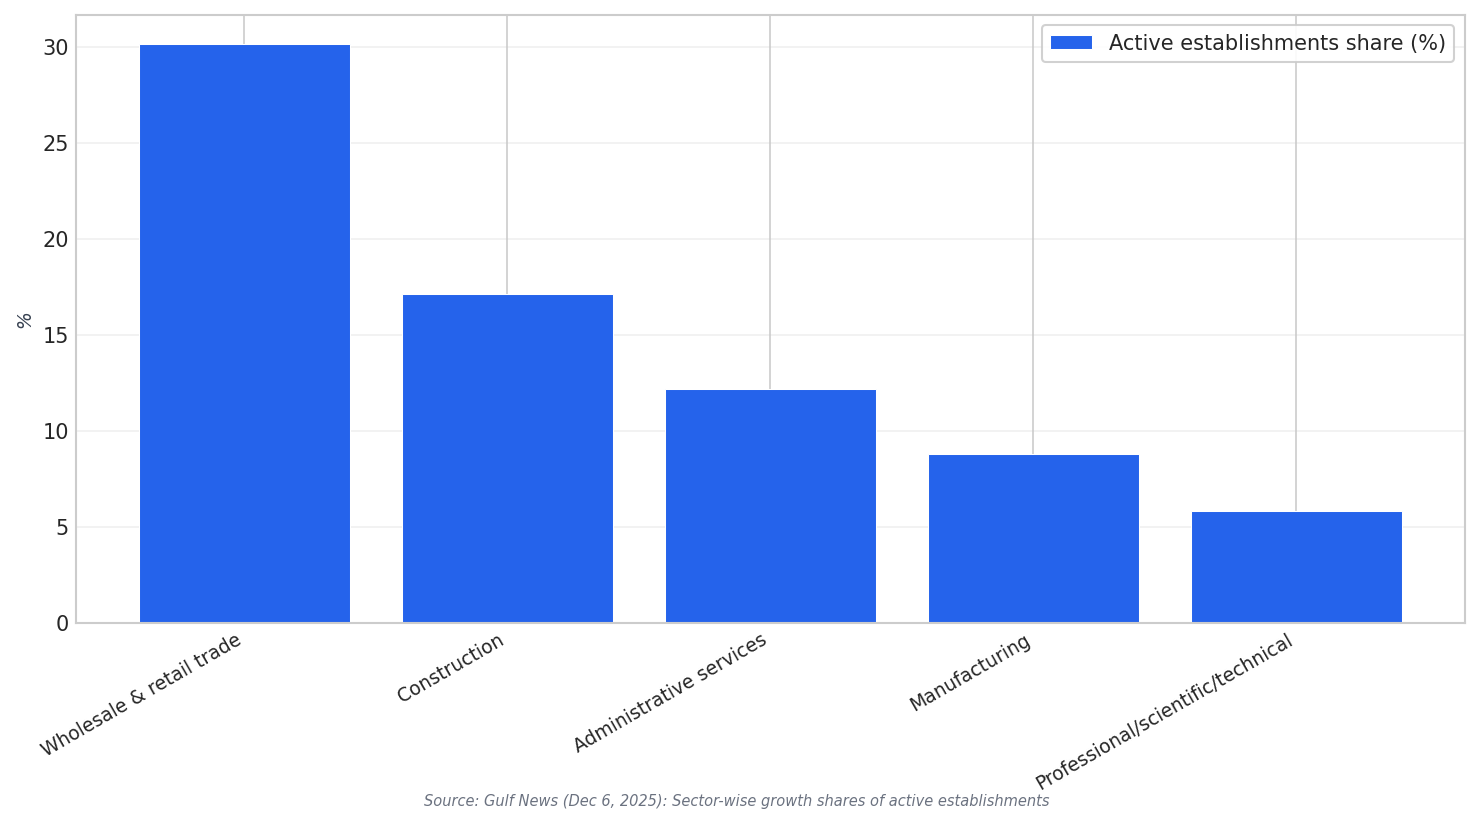
Planning CATI surveys UAE work in 2026 starts with a simple question: what population are you actually sampling? If your target is businesses, a sector-balanced establishment frame can be a practical starting point. Gulf News reported that wholesale and retail trade leads the number of active establishments at 30.15%, followed by construction at 17.13% and administrative service activities at 12.17%. It also listed manufacturing at 8.8% and professional, scientific, and technical activities at 5.85%. These shares can guide quota thinking, or help you sanity-check whether your contact list skews too heavily toward one sector.
Sample frames for CATI surveys UAE business studies should also reflect how the market changes over time. By the end of Q3 2025, the Ministry of Human Resources and Emiratisation (MOHRE) reported 8.9% growth in workforce size and a 6.6% rise in the number of operating establishments. For telephone survey operations, those growth indicators matter because older lists can decay faster when new entities enter the market. In practice, that pushes teams to refresh contact records more often, run stricter deduplication, and validate sector tags before dialing if your reporting needs to align with establishment shares.
Response Rates in 2026: Ground Truth Comes From Frame Quality
These sources do not publish CATI response rate statistics for the UAE. So you should avoid promising a numeric response rate without your own historical data. What you can do is tie response expectations to measurable, source-based conditions that affect reachability. A labour market with 8.9% workforce growth and 6.6% more operating establishments by Q3 2025 can mean more gatekeepers, more role changes, and more new numbers that are not yet in your frame. For CATI surveys UAE projects, response management becomes a workflow issue: better list hygiene and better targeting reduce wasted dials even when no public response-rate benchmark exists.
Cost benchmarks face the same limitation: none of the provided sources list UAE CATI cost-per-complete, interviewer hourly rates, dial-to-complete ratios, or telecom costs. Still, you can benchmark effort structurally using the sector distribution that is published. If a study must represent a business-heavy sector like wholesale and retail trade (30.15%) and a second large sector like construction (17.13%), your cost planning must account for the need to fill those cells reliably. If your list under-covers either sector, costs typically shift from interviewing to frame repair. That is not a numeric benchmark, but it is a defensible benchmark logic tied to published sector shares.
For 2026 reporting, be explicit about scope and avoid over-claiming. The chart values above describe the distribution of active establishments across sectors, not survey outcomes. Use them to document how you built or weighted your CATI surveys UAE sample frame and to explain why some segments take longer to fill than others. Pair that with MOHRE’s Q3 2025 indicators of 8.9% workforce growth and 6.6% establishment growth to justify why frequent updates and verification are part of your cost model. If you later add internal metrics, you can layer true response-rate and cost-per-complete benchmarks on top of this public context.
What does “CATI surveys UAE” sample framing mean in practice?
Which sectors dominate the active establishment mix used for benchmarking?
Are there published UAE CATI response-rate benchmarks in the provided sources?
What UAE trend suggests sample frames may need more frequent refreshes?