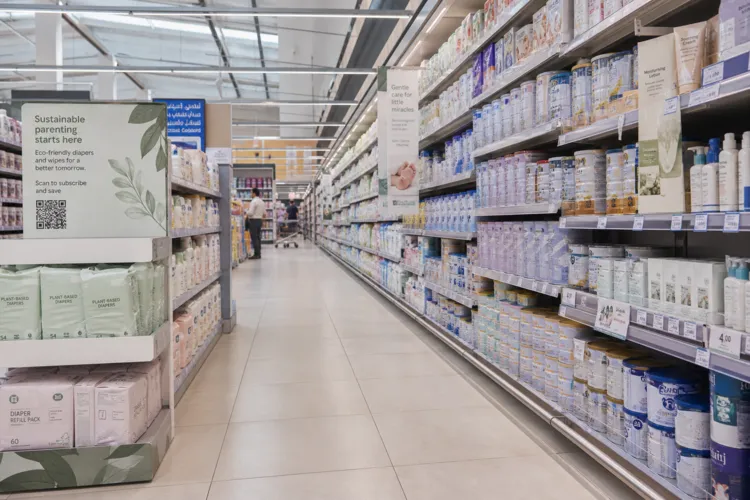

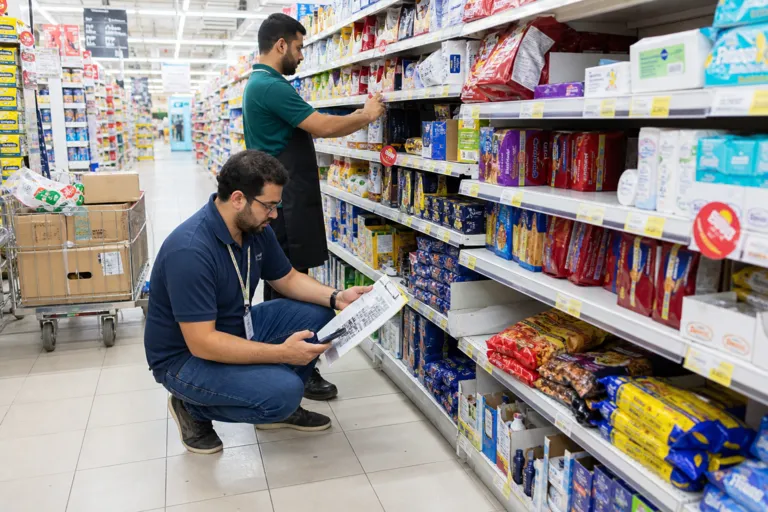
In the UAE, shelf execution is where distribution turns into real sales. Industry estimates place the UAE FMCG market at USD 16 billion to USD 18 billion in 2026, with a projected CAGR of about 4.5% to 5.5% from 2022 levels, which raises the stakes for getting the shelf right. A retail shelf audit UAE program focuses on what shoppers actually see: whether listed SKUs are present, whether they are visible, and whether stores follow the agreed shelf layout and pricing. A shelf audit, as defined in the sources, evaluates how products are stocked, placed, and presented to ensure availability, visibility, and compliance with planograms and pricing standards, so products are not just in the store, but on the shelf at the point of purchase.
For FMCG teams, the core shelf-audit KPIs map directly to execution outcomes. SKU availability answers whether all listed products are present on shelf, while planogram compliance checks if products are placed correctly and consistently across stores. Facing count tracks how many times a product appears on the shelf, which is tied to visibility and, as the source notes, generally higher sales. Pricing accuracy verifies that price tags and promotions are correct, reducing confusion and execution leakage. Share of shelf adds the competitive lens by quantifying how much space your brand occupies versus others, helping you spot where distribution may exist on paper but is not translating into physical presence.
Measuring Share of Shelf and Compliance With Photo-Verified Data
Share of shelf is especially useful because category shelf share is zero-sum: if a competitor gains facings, another brand loses them. Sources highlight that a brand can have strong market share but weak shelf presence, indicating under-representation at the point of sale and potential incremental losses to better-placed competitors. Measurement can be built from structured in-store pictures and calculated as linear space per brand from shelf photos, using manual analysis or image recognition. Post-negotiation compliance audits then verify whether agreed allocations are respected, including whether the correct number of facings per SKU is maintained in line with the planogram.
Technology is changing how quickly and consistently these audits happen. One retail image recognition platform cited in the sources reports deployment in 50+ countries and 16 industries with >98% accuracy, compared with ~80% accuracy associated with subjective self-reporting. It also lists common manual-audit constraints such as hours per audit and a 5–7 day data lag, versus KPI outputs in seconds with real-time insights and offline operation. In a separate global context, a guide notes that about 20% of FMCG store audits now happen via robots, drones, or AI-equipped cameras, and that planogram compliance monitoring alone can save retailers roughly USD 10,000 per store each year.
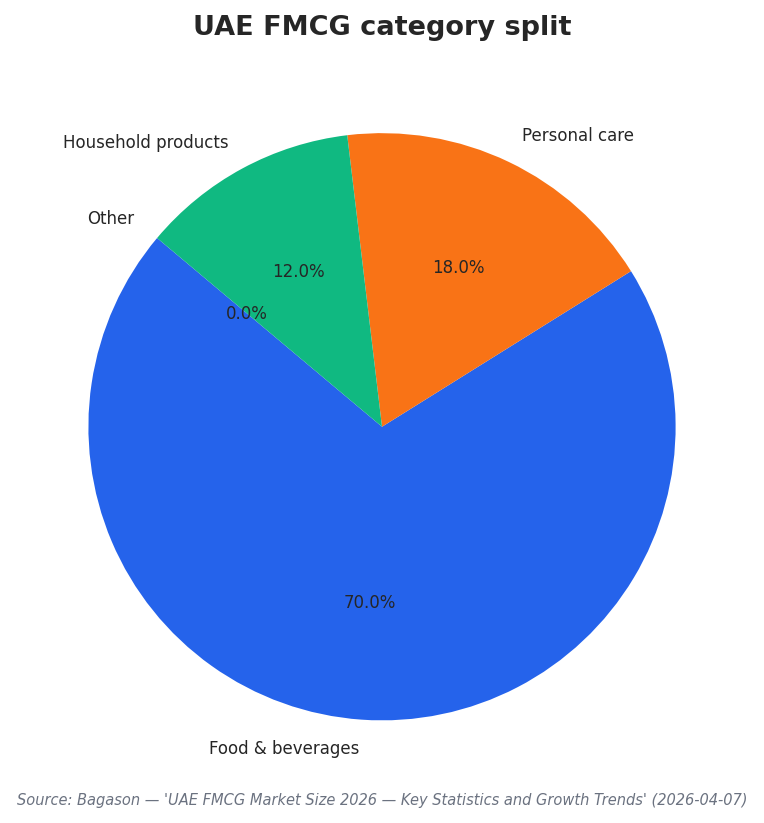
For UAE FMCG categories where shelf standards must be consistent across formats, audits help translate commercial agreements into store-level reality. The same UAE source estimates food and beverages account for roughly 65% to 70% of total FMCG spend, with personal care at approximately 15% to 18%, and household products at 10% to 12%. It also estimates the UAE imports approximately 85% to 90% of its food requirements, which can add complexity to availability and replenishment. By combining distribution checks (is the SKU listed and present), compliance checks (is it placed and priced correctly), and share-of-shelf tracking (is it winning enough space), brands and retailers gain the visibility needed to avoid missed opportunities and costly mistakes.
What does a retail shelf audit in the UAE measure for FMCG brands?
How is share of shelf measured in modern shelf audits?
Why do post-negotiation compliance audits matter?
What accuracy difference do sources cite between image recognition and self-reporting?
What global benchmarks show the shift toward automated store auditing?